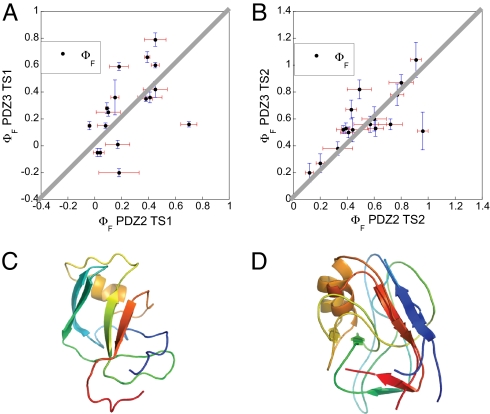
Fig. 3.
Comparison of folding transition states for two PDZ domains. (A and B) Comparison of the 17 Φ values measured at corresponding positions in PSD-95 PDZ3 (present work) and PTP-BL PDZ2 (34) for the early (A) and late (B) transition state events, respectively. The solid gray lines correspond to the unitary slope. The mutants included were (with PTP-BL PDZ2 mutations in parentheses) I316A (L18A), L323A (L25A), F325A (I27V), I327V (V29A), I336A (I42V), I338A (V44A), P346G (A52G), A347G (A53G), L353A (I59V), I359V (V65A), V362A (V68A), [E]A373G ([K]A79G), A375G (A81G), ([I]A377G) ([E]A83G), L379A (L85A), V386A (V92A), and I388V (L94A). For the two positions where the Φ value was calculated from a second mutation (Ala → Gly scanning in helix 2) the wild-type residue is given in brackets, e.g., [E]A373G, where the Φ value was calculated from the A → G mutation (and not the E → G). (C) A representative structure of TS1 of PSD-95 PDZ3. (D) Alignment of representative structures of TS2 of PSD-95 PDZ3 and PTP-BL PDZ2. The TS1 structures of the two proteins were too different to be aligned.

