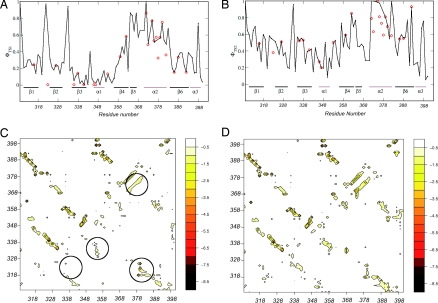
Fig. 4.
Characterization of the two transition state ensembles by molecular dynamics simulations with Φ value restraints. (A and B) Comparison of the experimental and calculated Φ values as a function of the position along the sequence for TS1 (A) and TS2 (B). (C and D) Energy maps of TS1 (C) and of TS2 (D); the native state is shown above the diagonal and the transition state below it. In C regions corresponding to the region corresponding to α2 in the native state and to its stabilizing contacts with the regions of β1 and β2 are encircled; also encircled are the areas of the interactions between the regions β2–β3 and β3–β4, which are very weak in TS1 but much stronger in TS2. The numbers on the energy scale in C and D are in kcal·mol−1.

