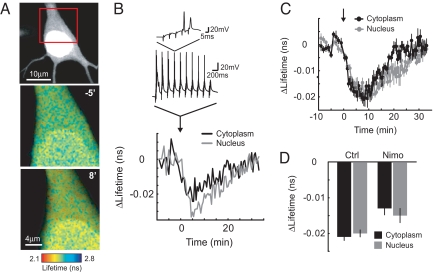
Fig. 5.
ERK activation in the cytoplasm and nucleus after theta-burst stimuli. (A) (Top) GFP fluorescence image of a hippocampal pyramidal neuron expressing EKARcyto and EKARnuclear in a cultured brain slice. (Middle and Bottom) Fluorescence lifetime images of the same cell (boxed area). Images are from before (−5 min) and after (8 min) theta-burst stimuli. (B) Changes in lifetime in the cytoplasm and nucleus for the example shown in A. At time = 0, theta-burst stimuli (5 synaptic stimuli at 100 Hz, repeated 10 times at 5 Hz) were delivered 3 times with 10-second intervals. Example perforated patch recordings at the soma are shown. ROIs for the cytoplasm and nucleus were distinguished based on fluorescence intensity. (C) Time course of ERK activation in the nucleus and cytoplasm after theta-burst stimuli. Data are from 7 cells. (D) Lifetime changes following theta-burst stimuli in the nucleus and cytoplasm in the presence or absence of the L-type VGCC blocker nimodipine (20 μM). Lifetime changes were the average of 3 time points around the maximum change within 15 min of the stimulus. Data are from 7 and 6 cells for control and nimodipine conditions, respectively.

