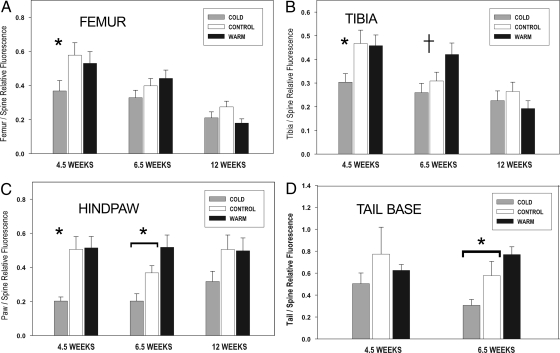
Fig. 3.
Relative hindlimb and tail blood flow measured by fluorescent microsphere deposition. Effects of chronic rearing temperature on blood flow to the femur (A), tibia (B), hindpaw (C), and tail base (D) by using the thoracic spine as an internal reference. Rearing temperature is shown by shaded bars within each age cluster. Means + 1 SEM plotted (n = 9 minimum per age and group; Table S1). For each age, a single asterisk indicates significant reduction in blood flow in the cold (P < 0.05, Tukey test) compared with either control or warm groups (e.g., 4.5-week femur, tibia, and paw). An asterisk overlying a horizontal bracket indicates that pairwise comparisons among all 3 groups were significant (e.g., 6.5-week paw and tail), and a crossbar (†) denotes significantly increased blood flow in the warm group compared with both cold and control (6.5-week tibia), all confirmed by Tukey test at α = 0.05. Tail samples were not collected at 12 weeks.

