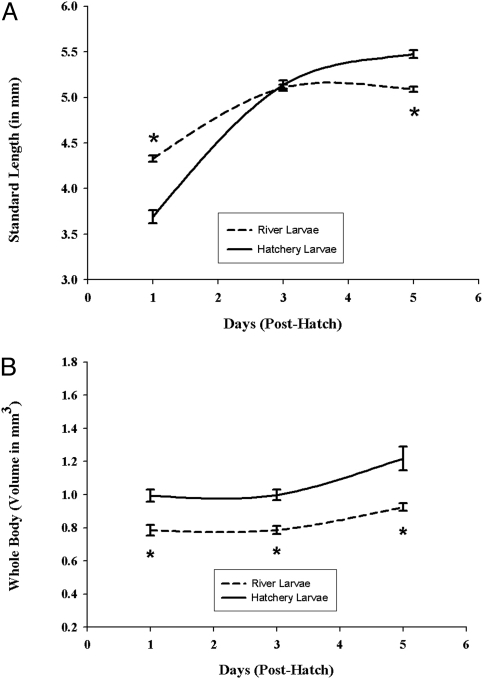
Fig. 1.
Comparison of the development of larvae from hatchery and river-collected striped bass. (A) Using standard length as a measure of size, this graph represents growth of river and hatchery larvae between day 1 and day 5 posthatching. Results represent the means ± SE of 12–15 hatchery larvae and 36–75 river-collected larvae. *, Significantly different from hatchery larvae; significance level P ≤ 0.001. (B) Using a technique (Cavalieri method) enabled us to compare whole-body volumes of river and hatchery larvae between days 1 and 5. Results represent the means ± SE of 12–15 hatchery larvae and 36–75 river-collected larvae. *, Significantly different from hatchery larvae; significance level P ≤ 0.001.

