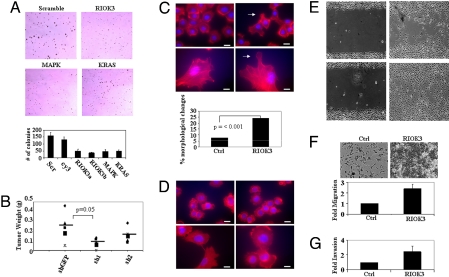
Fig. 2.
Functional analysis of RIOK3 in PDAC and immortalized human pancreatic ductal cells. (A) 8988T cells were transfected with two different siRNAs for RIOK3 (a and b) and controls (scrambled or a cy3 labeled control) and seeded into semisolid agar. Note the significant reduction of colonies of significant size as well as that of the KRAS and MAPK siRNAs when compared with the control scrambled siRNA (quantitation below). (B) 8988T cells transduced with RIOK3 shRNAs were injected s.c. into the flanks of nude mice. Tumor weights were plotted for each cohort. Horizontal lines represent the mean weight for the cohort. Xenografts derived from cells with highly efficient knockdown of RIOK3 (sh1) demonstrated a greater reduction in weight as compared with that with a less robust knockdown (sh2) and that of control tumors (shGFP) (P = 0.05; t test). (C) Top right image depicts immortalized human pancreatic ductal cells that have enforced expression of RIOK3 and are stained with rhodamine conjugated phalloidin to visualize the actin cytoskeleton. Note the change in cell morphology as compared with control cells (top left), particularly in the larger flattened morphology and development of membrane protrusions (white arrow). The lower images show a similar phenomenon in immortalized MEFs (right image, with enforced RIOK3 expression). White bar, 5 μm. Histogram shows the quantitation of the number of pancreatic ductal cells with morphological changes with an increase as compared with control (P < 0.001; Fisher Exact Test). (D) 8988T cells were transduced with a lentiviral shRNA for RIOK3. The top 2 images show the normal morphology of control (shGFP) infected cells. The bottom two images depict cells with RIOK3 knock down. As shown, these cells have a more flattened, enlarged shape with a decrease in cytoplasmic protrusions. White bar, 5 μm. (E) A scratch assay using pancreatic ductal cells either expressing a control vector (Top) or RIOK3 (Bottom) showing increased closure of the scratched area in the RIOK3 expressing cells. (F) These same cells were used in transwell migration assays, showing increased cell migration in ductal cells with enforced RIOK3 expression, which has been quantified in the graph below and expressed as fold of control cells. (G) Data from a representative experiment, showing RIOK3 increases cell invasion in Matrigel coated wells compared with control ductal cells.

