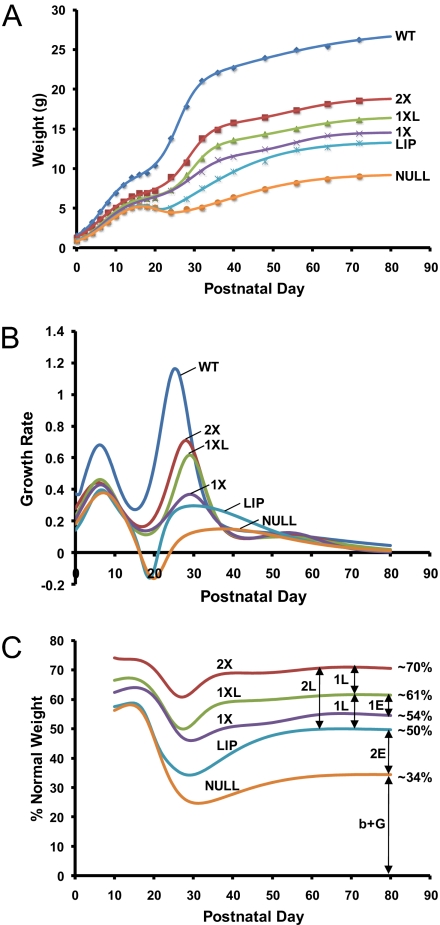
Fig. 3.
Growth analysis. (A) Growth curves derived by computer-aided regression analysis of average weights of WT (WT; n = 20), 2X (n = 4), 1XL (n = 6), 1X (n = 5), LIP (n = 3), and Null (n = 3) animals. For clarity, standard errors (all of small magnitude) are not displayed. (B) After growth curve fitting, the absolute growth rates (dW/dt) that are shown were calculated by subtracting the value of cumulative weight at a particular day (Wi) from that of the previous day (Wi-1), i.e., each curve point represents weight gain (g/day). (C) The growth curve regression data were also used to calculate relative weights (% of WT) for each genetically-modified mouse and to derive from the resulting steady-state values estimates of the contributions of endocrine (E) and local (L) IGF1 action to total body weight (for details, see Table 3). The distances between curves (arrows), corresponding to pairwise subtraction values between relative weights (Table 3), represent graphically the number of IGF1 “units” of endocrine and local action. Because the calculations were based on relative values, the final estimates of IGF1 contributions would be identical to those shown in Table 3 if, instead of the WT comparison standards, we had used weights relative to the 2X controls.

