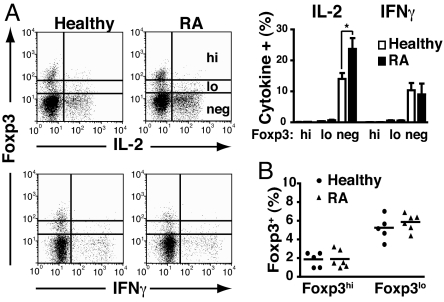
Fig. 1.
Foxp3 suppresses cytokine production in RA Treg. (A) Ex vivo PBMC from healthy controls and patients with active RA were stained for CD4, Foxp3, and IL-2 or IFN-γ. Representative FACS plots for IL-2 and IFN-γ production are shown. The bar graph shows the cumulative data of cytokine levels in healthy and RA Foxp3high (hi), low (lo), and negative (neg) cells (gated on CD4+ T cells). (B) Percentage of Foxp3hi and Foxp3lo CD4 T cells in healthy controls and patients with active RA is shown. *, P < 0.05

