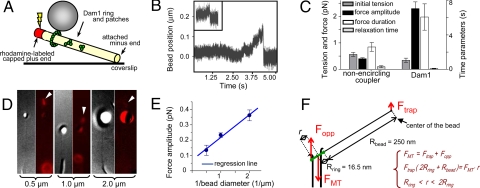
Fig. 1.
Quantitative analysis of the force-transducing attachments. (A) A schematic of the experimental system. Position of beads bound to the GDP-MT walls was followed with QPD before and after induction of MT disassembly. (B) Unprocessed QPD records of representative signals from a Dam1-coated bead in the presence of soluble Dam1 and a streptavidin-coated bead (Inset) relative to the center of the laser trap. (C) Mean values for the four parameters that describe force signals (see ref. 9 for details). (Left) 0.5-μm streptavidin-coated beads assayed with biotinylated MTs (n = 35). (Right) Wild-type Dam1-coated beads with soluble Alexa488–Dam1 (n = 26). (D and E) Force measurements carried out with streptavidin-coated beads: 0.5 μm (n = 45), 1 μm (n = 81; includes data from ref. 9), 2 μm (n = 35). Photos show DIC images of representative beads attached to MT walls and their fluorescence images (red) taken during dissolution of the rhodaminated GMPCPP caps (arrowheads). Graph shows median values for force amplitudes for these beads. Trap stiffness, ≈0.008 pN/nm. (F) Drawing (not to scale) of the forces from MT depolymerization and the laser trap. The fulcrum is at ring's edge on the bead-distal side of the MT; because of the ring's tilt, FMT is likely to act slightly off the MT axis, so its lever arm r is defined by a range. The bead (not shown) is 15 times larger than the ring, so a relatively small trapping force can stall the MT-disassembly-driven movement of the ring.

