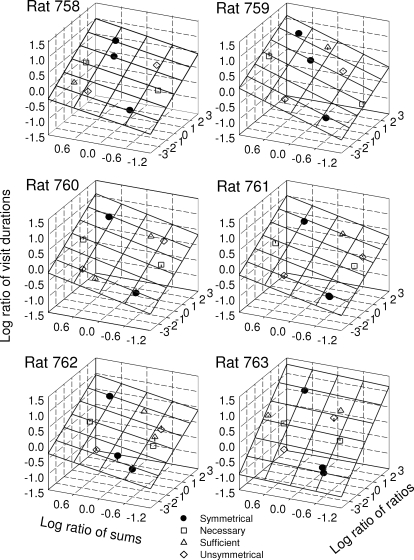
Fig 2.
The logs of the ratios of times plotted as a joint function of the logs of the ratios of the sums of the stay and switch reinforcers obtained per visit and the logs of the ratios of the ratios of the stay and switch reinforcers obtained per visit. The plane shows the best-fitting plane, using the stay/switch model (Equation 3) and data from all conditions.

