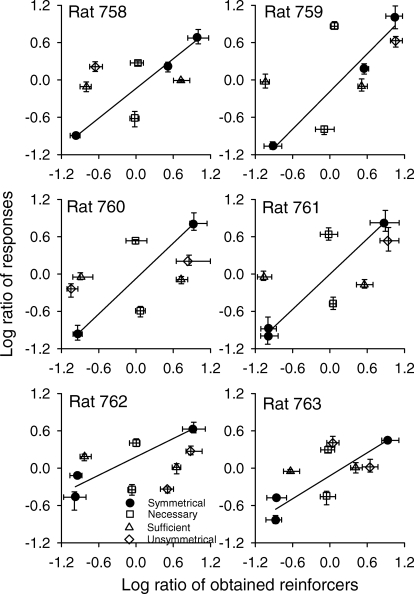
Fig 3.
The logs of the ratios of responses plotted as a function of the logs of the ratios of obtained reinforcers. The solid line shows the best-fitting line, using the generalized matching law (Equation 5) and data from symmetrical conditions. The horizontal and vertical range bars show the range of the reinforcer ratios and the response ratios, respectively, during the 5 days of stable responding.

