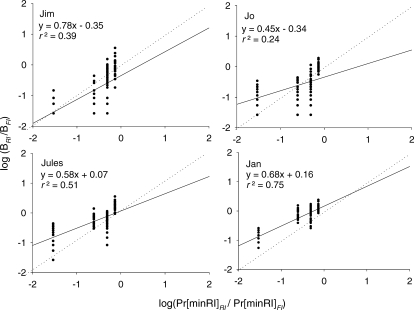
Fig 3.
Each point represents the logarithm of the proportion of entries into the RI terminal link to the proportion of entries into the FI terminal link (BRI/BFI) over the last 20 sessions of each condition plotted as a function of logarithm of the Pr[minRI] ratios (Pr[minRI]RI /Pr[minRI]FI) for each subject in Experiment 1. The solid lines indicate the best-fit regression line; the dotted lines indicate the line predicted by strict matching.

