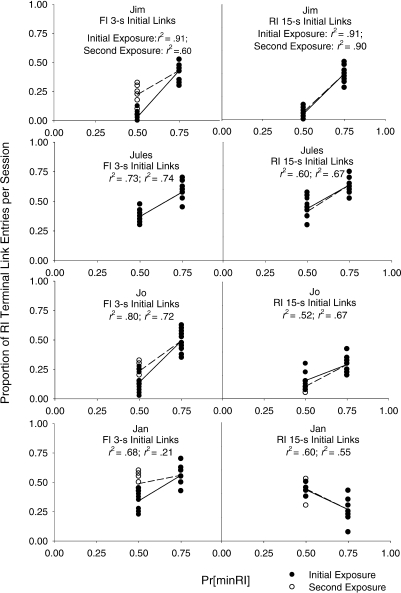
Fig 5.
The proportion of RI terminal link entries per session for last 10 sessions of the Pr[minRI] = .50 and Pr[minRI] = .75 conditions are plotted for each subject in Experiment 2 as a function of Pr[minRI]. The FI 3-s initial link conditions are displayed in the left hand panels and the RI-15 initial link conditions are displayed in the right hand panels. The closed data points indicate the initial exposure to the Pr[minRI] = .50 conditions in each initial link length while the open data points indicate the second expsosure to the Pr[minRI] = .50 conditions.

