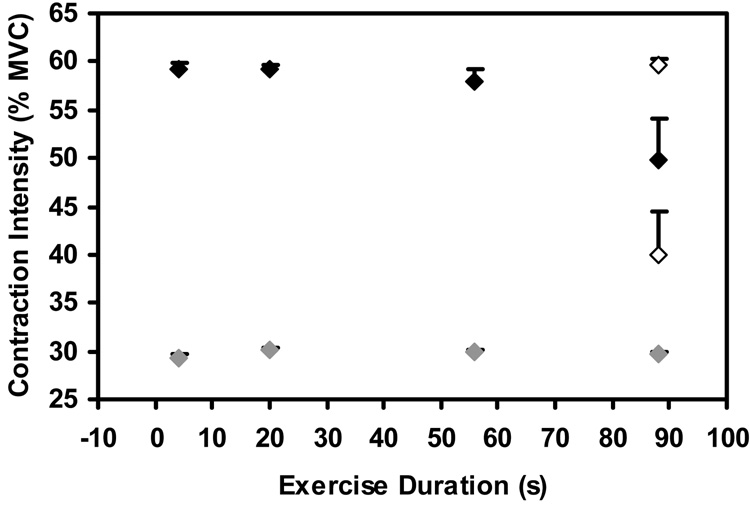
Figure 2.
Contraction intensity during 4 s windows centered on exercise durations of 8, 20, 56, and 88 s during the 30% and 60% MVC tasks. Mean, SEM is shown. No significant changes were observed for the group across exercise durations. However, four subjects underwent considerable fatigue (mean intensity at end-exercise=40.0% MVC) and four subjects were able to maintain the target force at end-exercise (mean intensity at end-exercise=59.6% MVC). The responses of these two groups of subjects are shown as the open symbols at t=88 s.

