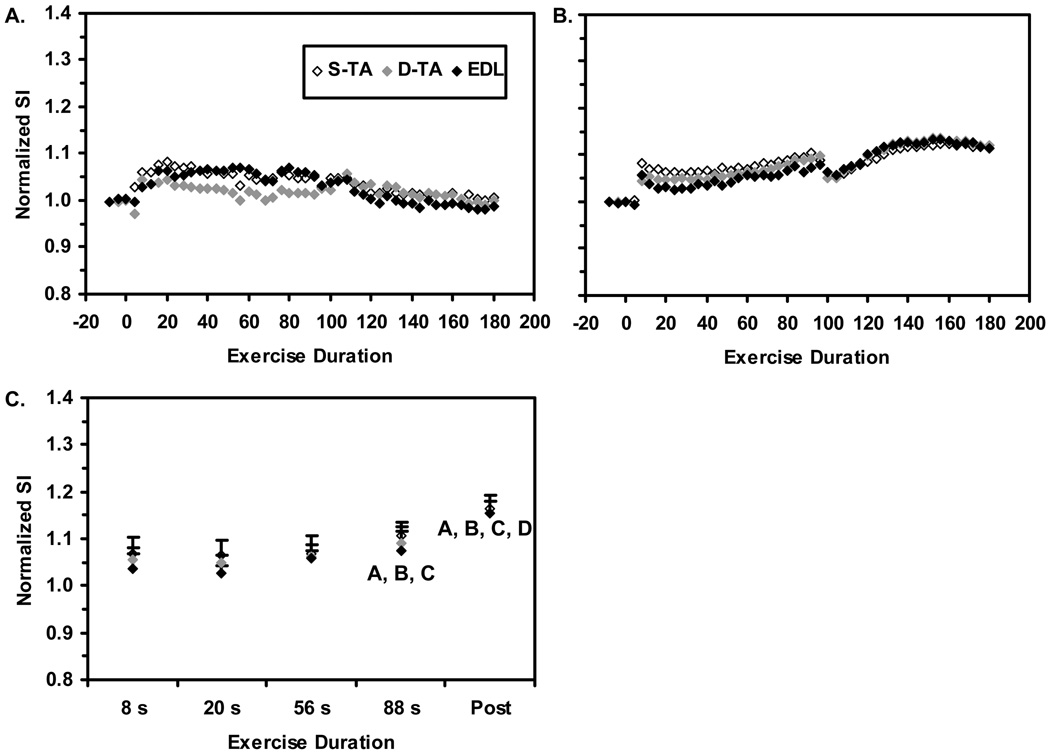
Figure 3. T2-weighted SI responses to 30% MVC contractions.
A. Sample data from one subject. B. Group-mean data for all subjects; for clarity, error bars are not shown. C. Group-mean data used in the discrete analysis. Error bars represent the SEM. The Duration main effect was significant, and so the symbols (A, B, C, D) represent significant differences between the indicated group mean SI value and the mean value at the t=8, 20, 56, and 88 s exercise durations, respectively. Neither the Compartment main effect nor the Compartment×Duration interaction were significant, and so contrasts indicated by the Duration effect apply equally to all compartments.

