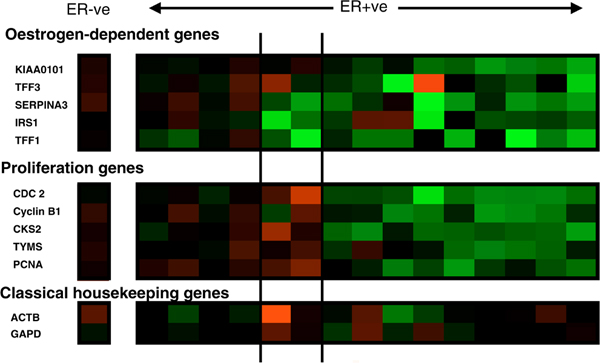
Figure 1.

Changes in expression of oestrogen-regulated and proliferation-associated genes after 14 days of adjuvant treatment with letrozole. Green represents downregulation and red upregulation (these will show as relatively paler blocks if you are viewing this figure in black and white). Intensity of colour/shade represents degree of change. The single column to the left of the figure represents changes in an ER-negative case; the panels relate to 15 different clinically resistant ER-positive tumours: the left-hand panel illustrates a molecular resistant phenotype; the middle panel shows cases exhibiting decreases in the expression of oestrogen-regulated genes but not in cell cycle genes; and the right-hand panel shows molecular sensitivity in both oestrogen-regulated and cell cycle associated gene expression. ER, oestrogen receptor.
