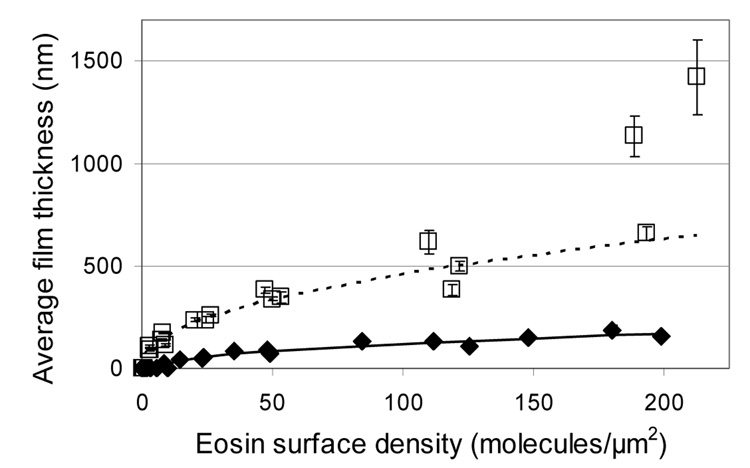
Fig. 5.
Comparison of film thicknesses achieved using the standard PEGDA formulation versus the acrylamide formulation. Curves are fit to the data using the equation thickness = k*(b-density)a. ◆ and —— represent the standard PEGDA formulation (420 mM PEGDA, 210 mM MDEA, and 35 mM VP). □ and ■■■ represent the acrylamide formulation (5.2 M acrylamide, 130 mM bisacrylamide, 210 mM MEA, 35 mM VP). The three acrylamide data points near 200 eosin/µm2 were not included in the curve fit, because the equation appears to be inappropriate for that region of the data.

