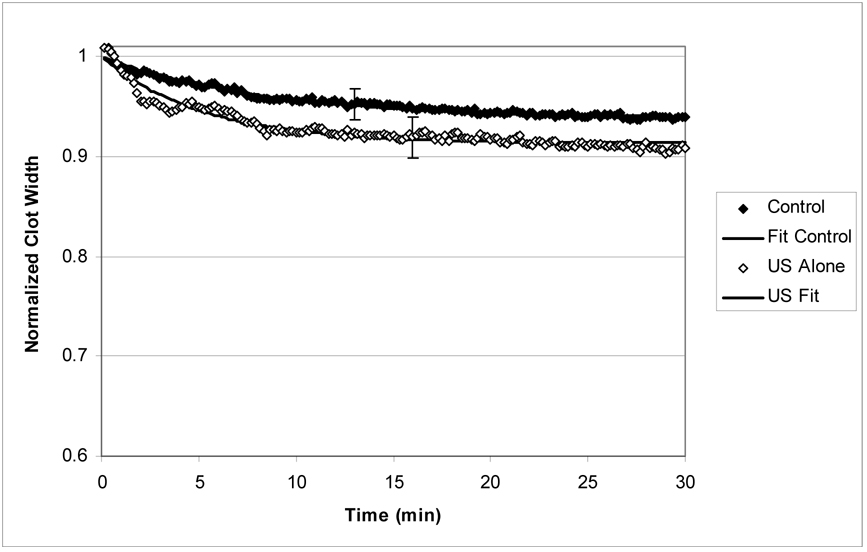
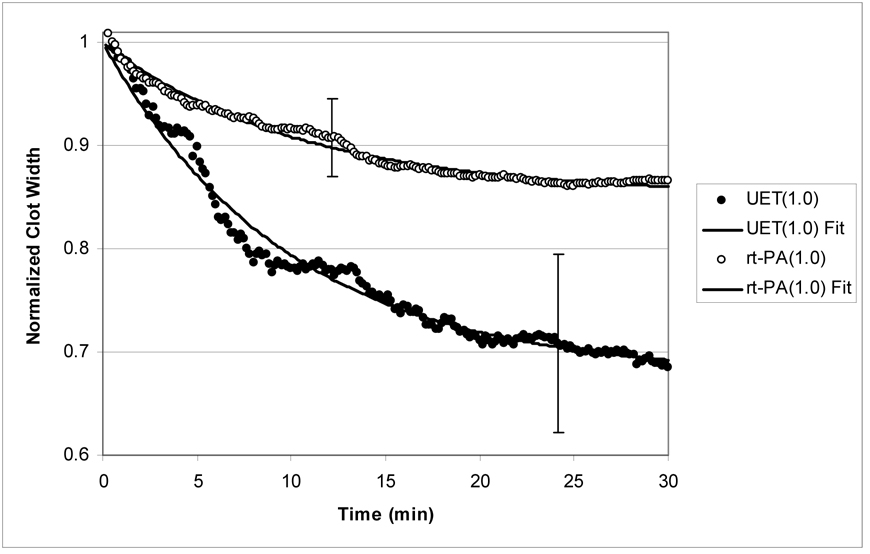
Figure 2.
Figure 2a: Normalized clot width (CWNORM) versus time for the ultrasound only and control treated clots. The error bars are representative standard deviations for the data. The solid lines are fits to equation (5) and the description is quite good.
Figure 2b: Normalized clot width (CWNORM) versus time for clots treated with rt-PA(1µg/ml) and UET(1µg/ml). As before, the lines are fits to equation (5), and the description is good. Note that there is significantly more clot lysis resulting from UET treatment as compared with rt-PA alone.


