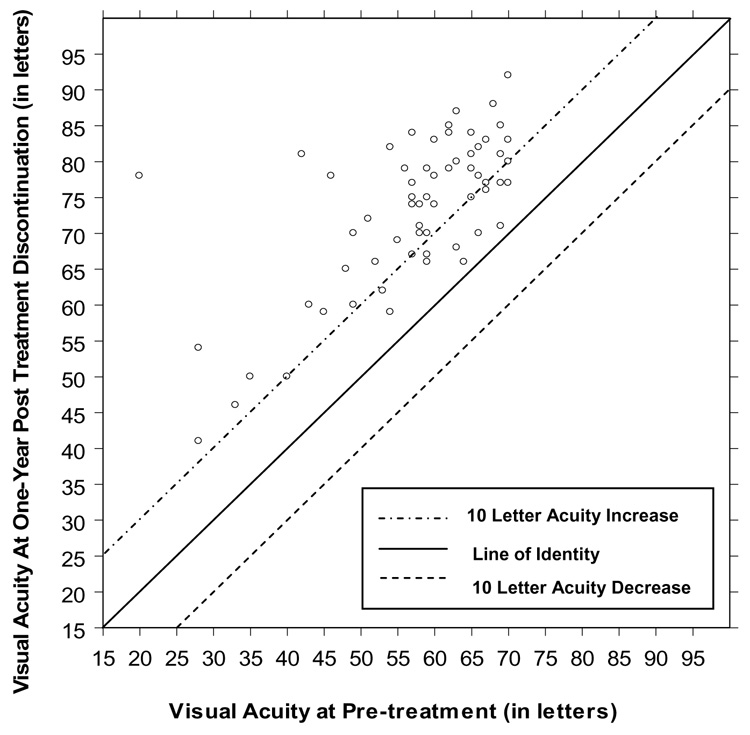
Figure 2. Visual Acuity At Pre-treatment Versus One-Year Post-Treatment Discontinuation Visual Acuity (N=67).

Plot includes all patients who completed the observation phase, defined as completing one year of follow up or experiencing a decrease of acuity of 10 or more letters during follow up. For the 1 patient who experienced an acuity decrease of 10 or more letters prior to the one-year visit, the one-year acuity is the acuity at the time of the decrease. A letter score of 85 corresponds to 20/20, with 5 letters representing one line. Lower letter scores indicate worse visual acuity.
