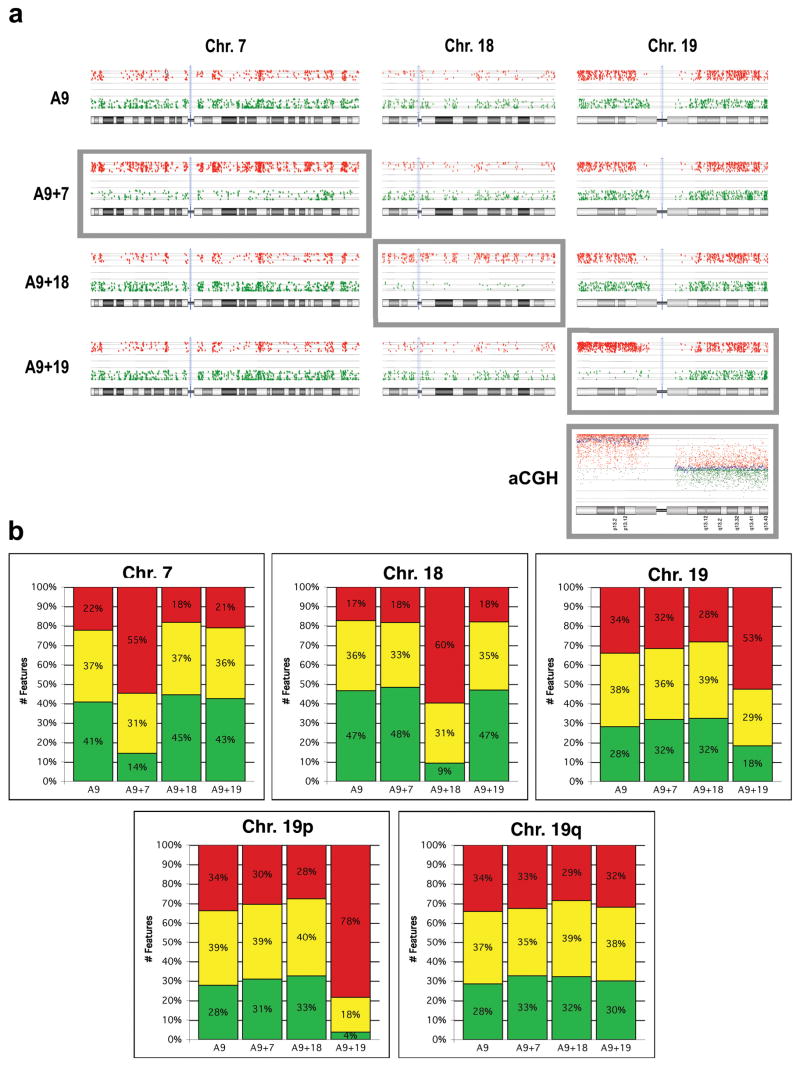
Fig. 3. Human chromosomes are transcriptionally active in mouse A9 cells.
(a) Gene expression profiles of HSA7, 18 and 19 in A9 and A9 hybrid cells. Red dots: cell line/human reference ratio >1.5 log2, Green dots: cell line/human reference ratio < -1.5 log2. Grey boxes indicate the human chromosome in each cell line. aCGH: Genomic profile of A9+19 relative to the A9 mouse cell line on a human oligonucleotide-based CGH microarray. Increased copy number for chromosome arm 19p is clearly indicated, while no change in 19q is observed.
(b) Top Panel: Quantification of Fig. 3a displaying the percentage of genes showing greater than a 1.5 log2 increase (red), more than a 1.5 log2 decrease (green) or no significant change (yellow) in gene expression levels for each of the human chromosomes in the A9 monochromosomal hybrid cell lines. Bottom Panel: HSA19 was further divided into p and q arms to demonstrate the difference in detected expression of these two chromosome arms.

