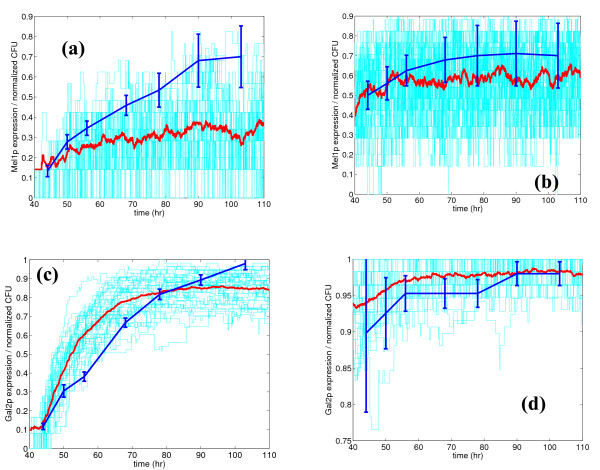
Figure 10.
Dynamic experimental data (44 – 100 hrs) for growth (in normalized CFU) on melibiose (Mel1p) and on galactose (Gal2p), along with simulations of Mel1p and Gal2p expression, at two glucose concentrations (1 mM and 27.8 mM). Figures (a) and (b) show results for Mel1p at 27.8 mM and 1 mM, respectively. Figures (c) and (d) show the results for expression of Gal2p at 27.8 mM and 1 mM, respectively. Light colored lines show results of individual simulations, the solid line shows the mean of these simulations, and the dashed line with error bars shows the experimental data.

