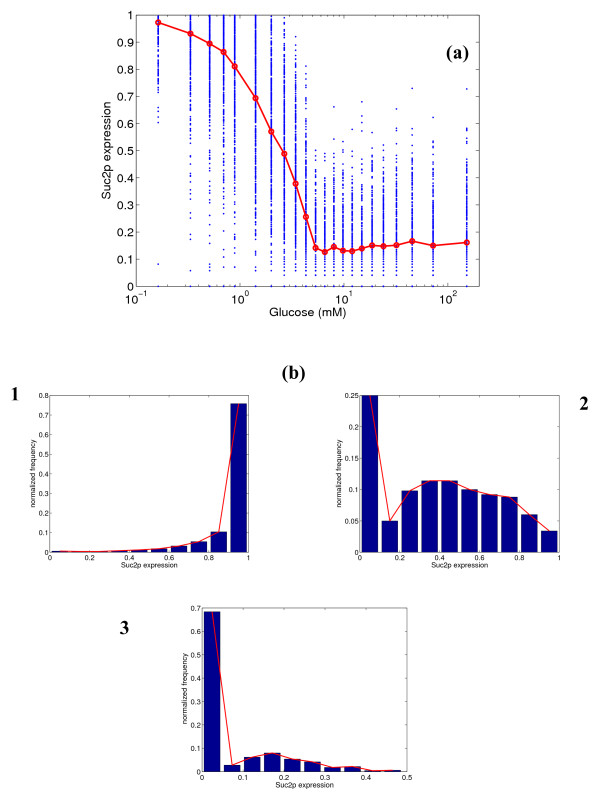
Figure 5.
(a) Simulated steady state protein expression for Suc2p at different glucose concentrations, and (b) distribution of expression at 0.33, 2.67 and 6.55 mM glucose. In figure (a), the blue dots represent the range of expression values over 500 simulations, and the red line represents the mean expression.

