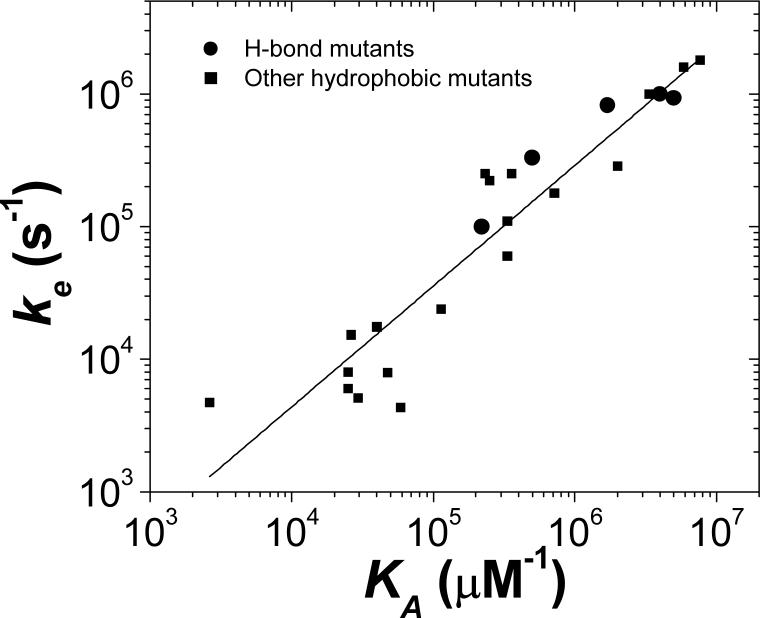
Figure 7.
The cyt c2 :RC first order electron transfer rate constant ke versus the binding constant KA for native and mutant RCs. The rates for H-bond mutants determined in this study (●) are plotted with rates previously determined (■) for hydrophobic mutant RCs (11). The H-bond mutants follow the same general trend in which changes in ke are roughly proportional to changes in KA

