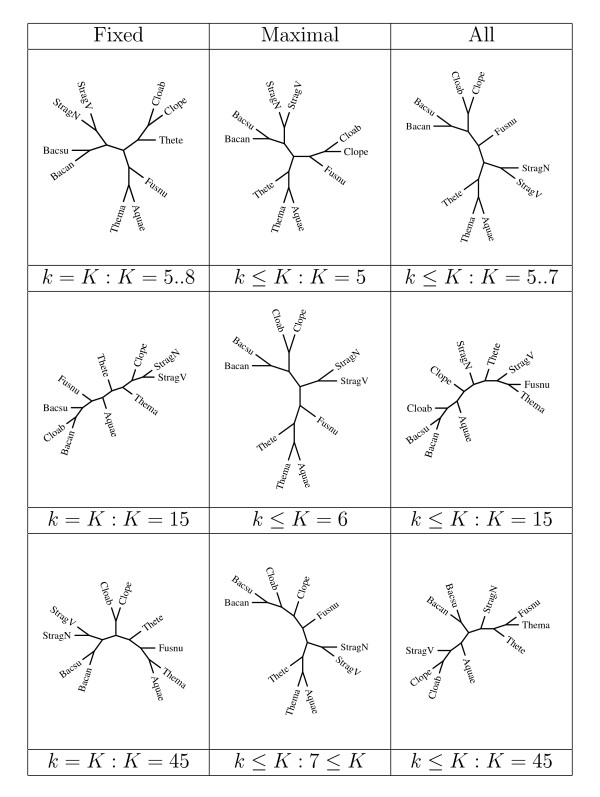
Figure 2.
Phylogenetic trees derived for small samples under various compositional distances. With a sample of "closer" species, some differences appear in the tree already for small values of k (top row): all fixed k-mers with k = 5, same as for k = 6 or 7 (left); maximal k-mers up to a maximum K = 5 (center); and all k-mers up to a maximum K = 5, same as for k = 6 or 7 (right). This is repeated with K = 15 in the second row, with K = 45 in the third row except for the middle entry set at K = 6 and K = 7, respectively, since trees then stabilize for higher K.

