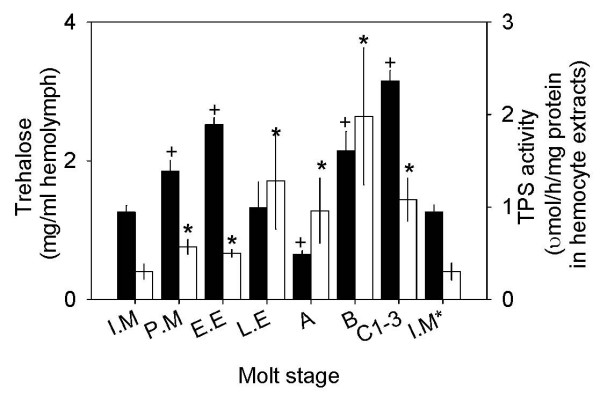
Figure 4.
Changes in the levels of trehalose in hemolymph and TPS activity in hemocytes during molt cycle. Data is presented as mean ± 1 SE (n = 8–15) of trehalose in mg/ml hemolymph (solid bar) and of TPS enzyme in μmol/h/mg protein in hemocyte extracts (open bar). Statistical significances at P < 0.05 marked as + (trehalose) or * (TPS activity) were determined using Student's t test by comparing the values at intermolt stage with each different molt stage. I.M = intermolt, P.M = premolt, E.E = early ecdysis, L.E = late ecdysis, A = within 3 h after ecdysis, B = 1–2 days after ecdysis, C1–3 = 3–7 days after ecdysis, and I.M* = same as I.M.

