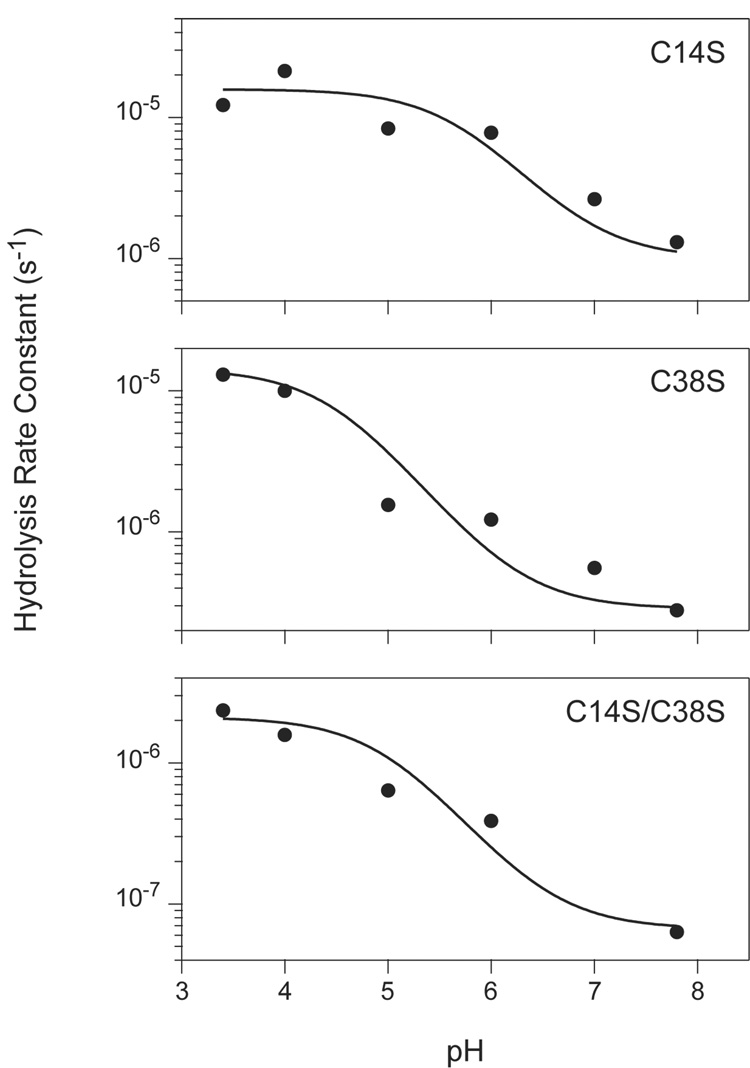
Figure 5.
Apparent rate constants for hydrolysis of BPTI variants by trypsin versus pH. Hydrolysis reactions were carried out at the indicated pH values and the progress of the reactions were monitored by reversed-phase HPLC, as illustrated in Figure 2 and Figure 3. Rate constants for the reactions were determined by least-squares fitting to a first-order decay function as shown in Figure 4. The curves represent the function described by Equation 7 in the text, with the parameters estimated manually. For all three of the variants, the values of k1 and k2 were both set to 10 s−1. The values used for k−1 for the three mutants were: C14S, 1×10⁸ s−1; C38S, 3.5×10⁸ s−1; C14S/C38S, 1.5×10⁹ s−1. The pKa values used were: C14S, pK1 = 5.7, pK2= 6.9; C38S, pK1 = 5.7, pK2 = 6.9; C14S/C38S, pK1 = 5, pK2 = 6.5.

