Figure 2.
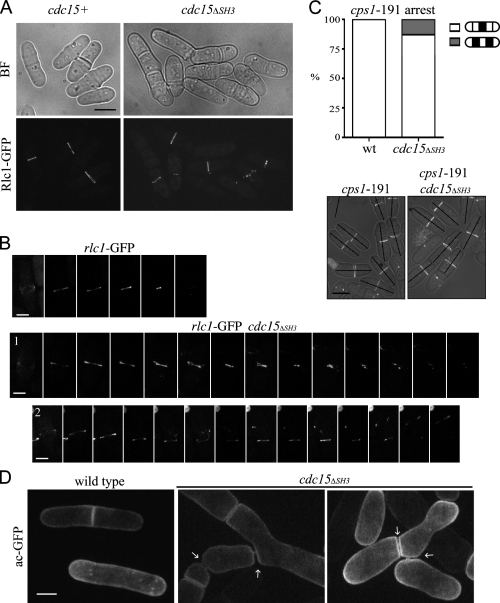
cdc15ΔSH3 cells show defects in contractile ring dynamics. (A) rlc1-GFP and rlc1-GFP cdc15ΔSH3-FLAG3 cells were grown and imaged as in Fig. 1 D. BF, bright field. (B) rlc1-GFP and cdc15ΔSH3-FLAG3 rlc1-GFP cells were imaged live at 25°C every 2.5 min (Videos 1 and 2, available at http://www.jcb.org/cgi/content/full/jcb.200806044/DC1). Montages of cells completing cytokinesis are shown. Each image is 12.5 min apart. (C) cps1-191 rlc1-GFP and cps1-191 cdc15ΔSH3-FLAG3 rlc1-GFP cells were arrested and imaged. In the images, cells were divided into fifths, and the location of the contractile ring was quantified (n = 100). wt, wild type. (D) acyl-GFP was expressed in wild-type or cdc15ΔSH3-FLAG3 cells and imaged live. Membrane bridges remaining after cytokinesis are marked with arrows. Bars: (A and C) 5 μm; (B) 2 μm; (D) 3 μm.

