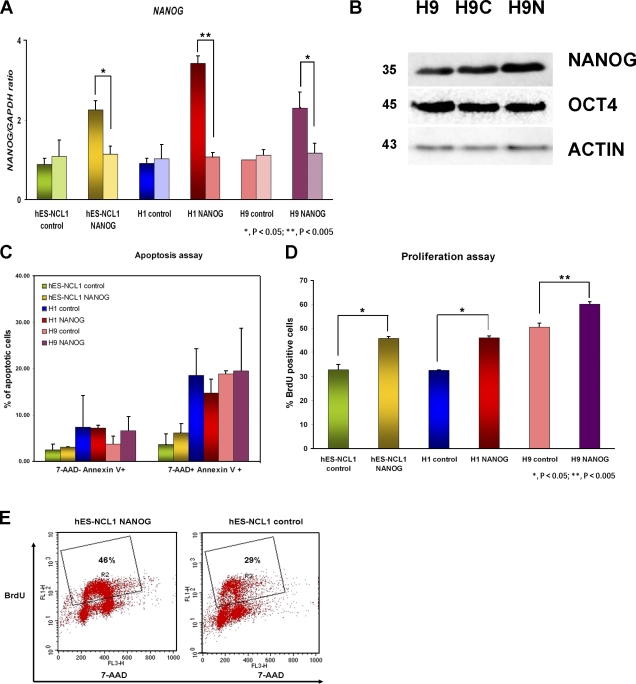
Figure 1.
Characterization of NANOG-overexpressing hESC sublines. (A) Quantitative RT-PCR for endogenous (right bars) and total (left bars) expression of NANOG in H1, H9, and hES-NCL1 sublines. The data represent the mean ± SEM (error bars) from four independent experiments. The value for the control clone from each hESC subline was set to 1, and all other values were calculated with respect to this. (B) Western blot showing NANOG and OCT4 expression in the H9 sublines. β-Actin was used as a loading control. H9, wild-type untransfected cells; H9C, H9 control subline; H9N, H9 NANOG-overexpressing subline. Molecular masses are indicated in kilodaltons. (C) Assessment of cell death in NANOG-overexpressing and control sublines by flow cytometry analysis. (D) Assessment of cell proliferation in NANOG-overexpressing and control sublines by flow cytometry after 45 min of BrdU incorporation. (C and D) The data represent the mean ± SEM from three independent experiments. (E) Flow cytometry images showing a higher percentage of proliferating cells (gate R2) in NANOG-overexpressing sublines compared with controls.

