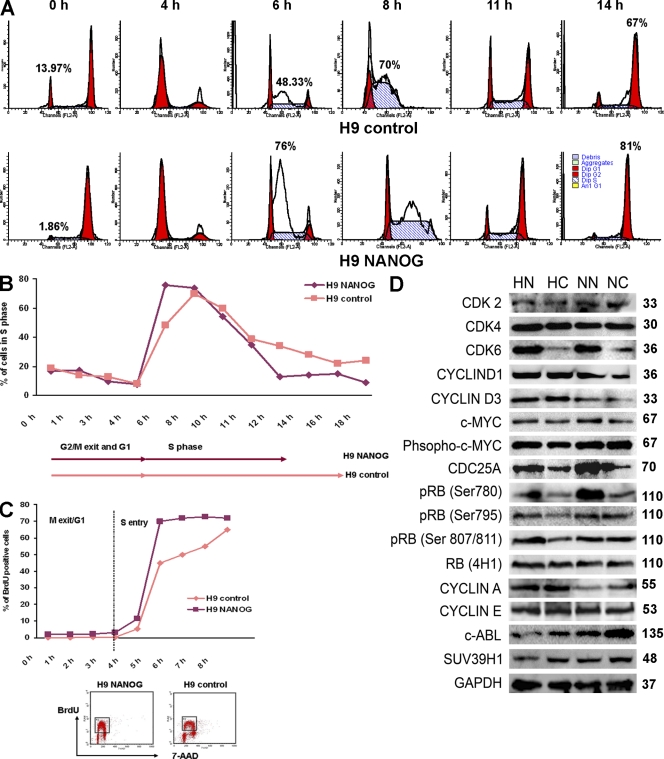
Figure 3.
Changes in hESC cell cycle distribution as a result of NANOG overexpression. (A) Flow cytometry images showing movement of cells through the cell cycle after synchronization by nocodazole for 18 h assessed by propidium iodide staining. This figure represents an example of three independent experiments. (B) Chart representation of the fraction of cells in S phase assessed by propidium iodide staining over time after release from synchronization with nocodazole for 18 h. (C) Chart representation of the fraction of cells in S phase assessed by BrdU incorporation over time after release from synchronization with nocodazole for 18 h. The bottom panel shows flow cytometry images of BrdU-incorporating cells in NANOG and control H9 hESC sublines after 5 h of release from nocodazole. The dashed line represents the end of G1 and the start of S phase. (B and C) The figure represents an example of three independent experiments performed in H9 sublines. (D) Western blotting for expression of main components involved in G1 to S transition in NANOG-overexpressing and control clones. This summary is a representation of three independent experiments. GAPDH was used as a loading control. p16 and p15 were absent in all sublines, whereas p19 and p18 were expressed at very low but equal levels in NANOG-overexpressing and control clones (not depicted). Molecular masses are indicated in kilodaltons. HN, H1 NANOG; HC, H1 control; NN, hES-NCL1 NANOG; NC, hES-NCL1 control.

