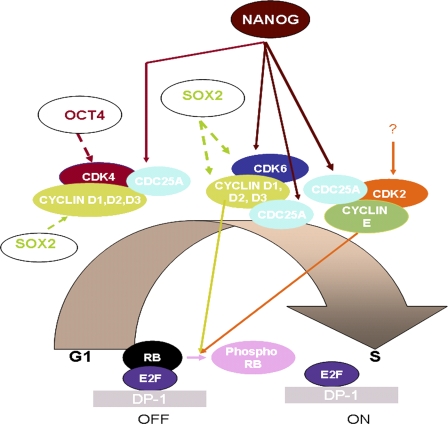
Figure 8.
Schematic presentation of G1 to S transition in hESCs showing the role of NANOG, CDK6, and CDC25A. A question mark is used to indicate lack of information of upstream regulators for CDK2. Data regarding the formation of active complexes between three G1-specific Cdks and CYCLIN D and E as well as CDC25A have been obtained from ongoing work in our group (Neganova et al., 2008). Continuous lines represent data obtained from this manuscript, whereas dashed lines indicate data obtained from literature (Boyer et al., 2005).

