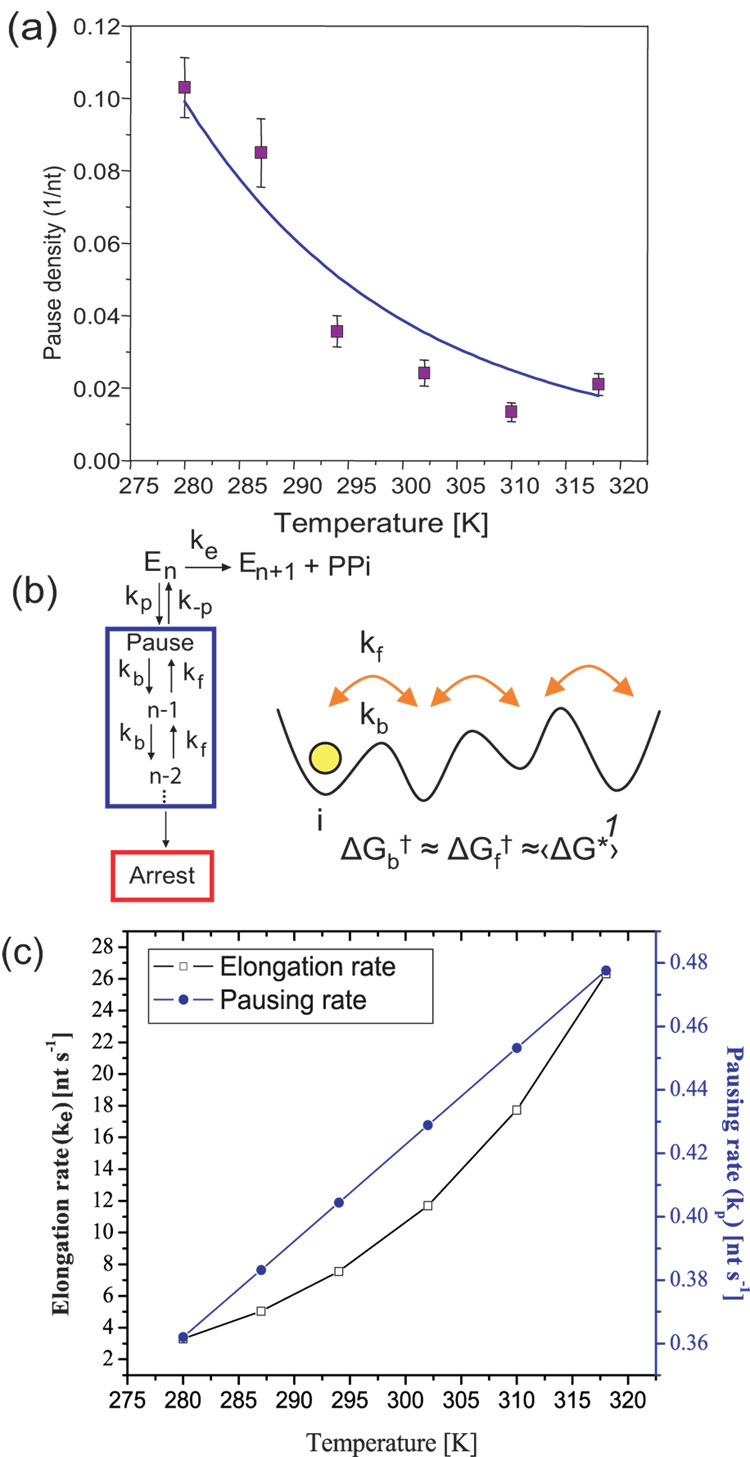
Fig. 4.
Kinetics of elongation and pausing. (a) The pause density (pauses/nt, for pauses >1 second) as a function of temperature. The fit to eqn 2 (solid line, R2= 0.9) suggests a kinetic competition between the elongation and pausing pathways and gives an activation energy of 1.29 ± 0.05 kcal/mol for entry into a pause. Error bars represent the standard error of the mean. (b) Simplest kinetic In this model ke is a convolution of the rate constants of all the processes that take the enzyme from n to n+1, including all reversible and irreversible steps, making ke an effective rate of transcription. The same way, kp is the effective rate for pause entry. Once in a pause, pauses are well described by diffusion in a 1D energy potential backwards along the DNA. The inset shows this diffusion schematically, where kf and kb are the forward and backwards rates, respectively; ΔGf† and ΔGb† are the corresponding activation energies. The active site is represented by 1. (c) Elongation (ke) and pausing rates (kp) vs. temperature plotted using the Arrhenius equation and the values obtained for ΔGe†, keo,ΔGp† and kpo, as described in the text. The elongation rate increases more rapidly than the pausing rate due to its increased activation energy. The starting force for all traces was 2 pN (5 pN for 21°C). All runs go up to their arrest force.

