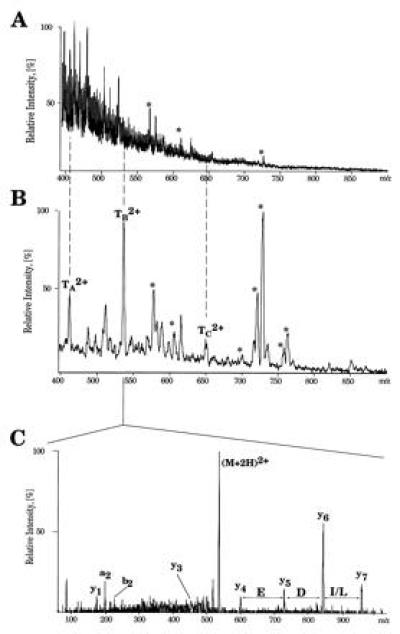
Figure 3.

High sensitivity protein identification by nano electrospray mass spectrometry. (A) Mass spectrum (Q1 scan) of a tryptic digest of a spot marked by an arrow on Fig. 4. Ions of trypsin autolysis products are marked (∗). (B) Parent ion scan spectrum for the immonium ions of Leu/Ile (m/z 86) acquired using the same digest. Ions of tryptic peptides are designated TA–TC. (C) Tandem mass spectrum of the doubly charged ion TB2+. The first mass of the fragmentation series, the sequence as determined by the mass differences between fragment peaks and the last mass in the series were entered as (600.2)ED(L/I)(957.4) into peptidesearch together with the measured peptide mass. Yeast protein VMA2 was unambiguously identified by the peptide sequence tag as shown in the spectrum. The letters refer to N-terminal (a and b) and C terminal (y) fragmentation at the amide bonds (38).
