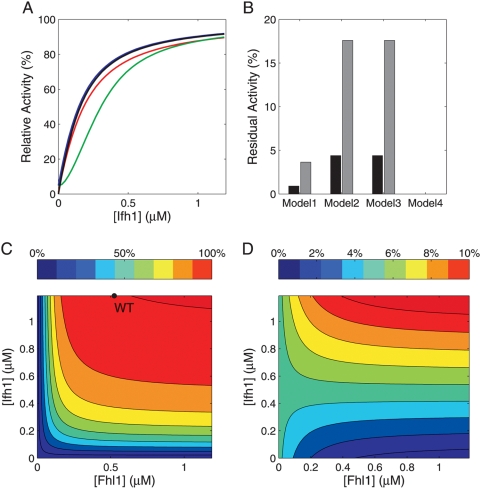
Figure 2. Stationary regulatory properties of the promoter designs.
(A) Stationary input-output characteristics with variable Ifh1 input concentration (basal activity of η = 0.05) for models 1 (red), 2 (green), 3 (blue), and 4 (black). (B) Normalized residual promoter activity in the absence of Ifh1 for basal activities of η = 0.05 (black bars) or η = 0.20 (grey bars). (C and D): Promoter activity as a function of total Ifh1 and Fhl1 concentrations (η = 0.20) for wild-type model 1 (C) and for a variant with 100-fold decreased Ifh1 affinity (D). Color codes represent percent of maximum promoter activity and the black circle in (C) indicates the operating point in vivo.

