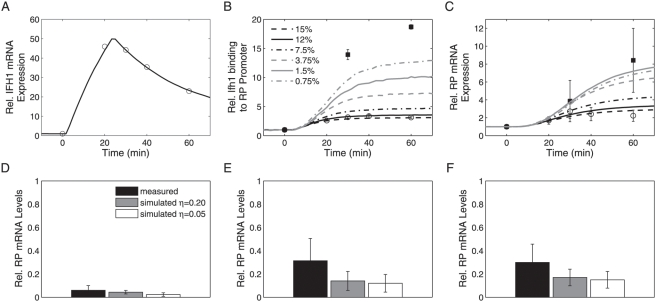
Figure 7. Validation of the most realistic model (Model 1).
(A–C) Dynamic responses to induction of GAL1-controlled IFH1 expression upon shifting from a non-inducing carbon source to galactose. Experimental data are shown as symbols (circles: data from Schawalder et al. [31] for glycerol+lactate→galactose, squares: data from Wade et al. [32] for raffinose→galactose). Model predictions (lines) are averages of n = 10,000 or 50,000 stochastic runs (η = 0.05). IFH1 mRNA (A), Ifh1 promoter occupancy (B), and RP mRNA (C) for the fitted IFH1 mRNA time course and varying basal IFH1 expression (0.75–15% of WT level on glucose). In (B) and (C), error bars represent standard deviations of the mean based on n measurements; (B) open circles (n = 3), filled squares (n = 4), (C) open circles (n = 113), filled squares (n = 5). See Protocol S1 for details. (D–F) Predicted stress response of RP mRNA levels. Comparison of simulated and measured RP mRNA levels under various stress conditions (experimental data from [32]) for heat shock (D), osmotic shock (E), and rapamycin addition (F). Error bars indicate the standard deviation of the mean for three RP genes (RPL2B, RPL27B, and RPS11B; SGD S000001280, S000002879, and S000000252). Simulations were performed for basal promoter activities of η = 0.05 and η = 0.20, respectively. See Protocol S1 for details.

