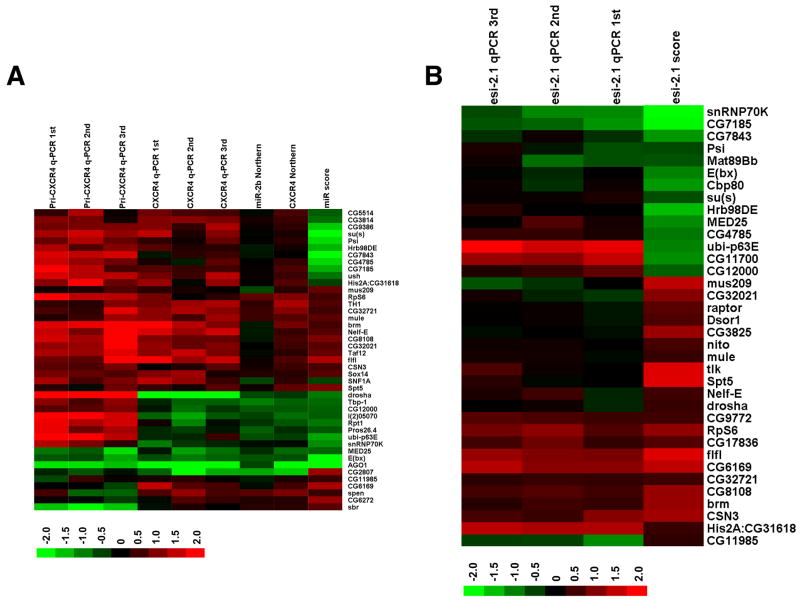
Fig. 2. Mapping candidates along the small RNA pathway.
(A) A heat map of steady-state pri-miRNA and miRNA levels upon knockdown of candidates. Steady state levels of CXCR4 and those of endogenous miR-2b upon knockdown of 43 selected candidates were examined by Northern blotting and semi-quantitative RT-PCR (q-PCR). miRNA levels were quantified and normalized first against U6 RNA levels, and then against the average of multiple controls (cells treated with dsRNA against LacZ). Also shown are steady-state levels of pri-CXCR4 measured by q-PCR, and the relative miRNA pathway activities associated with the representative dsRNA. Red indicates an increase in RNA levels, or an increase in the activity of the miRNA pathway, and green indicates a decrease. Presented are the average from 2 to 4 independent Northern blotting experiments and results from individual independent q-PCR assays. The scores associated with each candidate were from experiments involving one representative dsRNA targeting that gene (Table S3). (B) A heat map of endo-siRNA levels upon knockdown of candidates. Steady-state levels of esi-2.1 upon knockdown of 36 selected candidates were examined by q-PCR using multiple independent RNA samples. Quantification was performed as described in A. Also shown are the relative esi-2.1-mediated gene silencing activities. The scores associated with each candidate were from experiments involving one representative dsRNA (Table S4).

