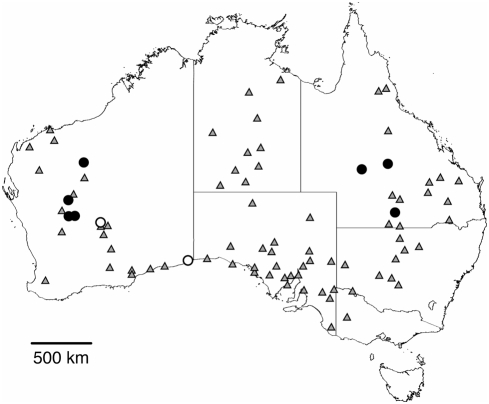
Figure 2. Map of the known distribution of Chlorobalius leucoviridis modified from Rentz [41] (grey triangles).
Solid black dots show locations where katydids were collected for this study. White dots represent locations where C. leucoviridis were heard making their calling song and/or seen by the authors but not collected.

