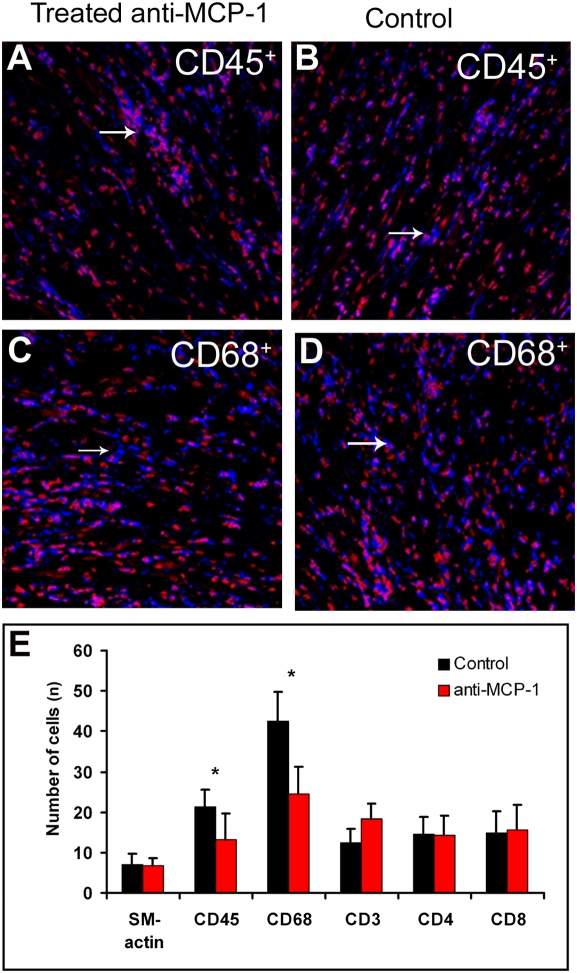
Figure 3. Immnunohistochemical analysis of mouse cardiac allograft treated anti-MCP-1 or isotypic control.
(A and B) Distribution of CD45+ leukocytes in cardiac allografts treated with anti-MCP-1 antibodies (A) and control isotypic antibodies (B). (C and D) Distribution of CD68+ leukocytes in cardiac allografts treated with antibodies against MCP-1 antibodies (C) and control isotypic antibodies (D). Blue, positive signal; red, nuclear counterstaining. (E) Numbers of αSMA-positive vessels and leukocytes expressing CD45, CD68, CD3, CD4, and CD8. *p<0.05.

