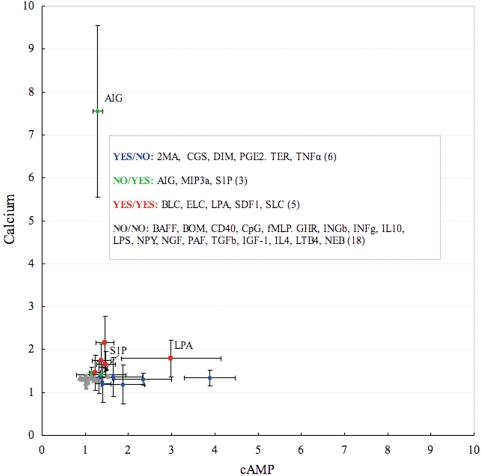
Figure 2. Peaks of fold changes for 32 B-Cell ligands classified into four groups with observed ‘YES’ and non-observed ‘NO’ elevation of cAMP and Ca2+.
Standard deviations (SD) are shown by the vertical bars. Full names for the ligands are listed in Table S1. S1P and LPA ligands are marked to be visible as they are given more detailed discussion in the manuscript.

