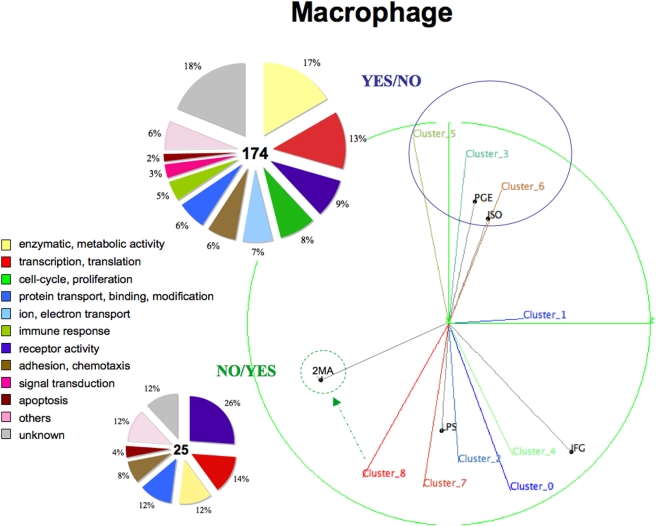
Figure 5. Clustering results on 5 macrophage ligands with available microarray expression data: PGE, ISO (YES/NO), 2MA (YES/YES) and LPS, IFG (NO/NO).
Two cAMP-activated ligands (PGE and ISO) form a distinct sub-region within the hyperspace. NO/NO ligands (LPS and IFG) do not form a single sub-region. 2MA is an only YES/YES ligand remoted from YES/NO sub-region as well as from NO/NO ligands. Possibly Cluster_8 is the influenced by 2MA. This representation, which we call ‘PCA correlation ball’, shows both the groups of ligands and their correlations, and also the regulations of gene clusters from the projections of nearby ligands. Genes functions (‘Function’ or ‘Cellular process’ (GO terms), if ‘Function’ is absent) calculated basing on the enrichment in clusters with p-value<0.05 are shown in the pie-graphs. By the reason of small number of genes we combined up- and down- regulated gene together in the pie-graphs.

