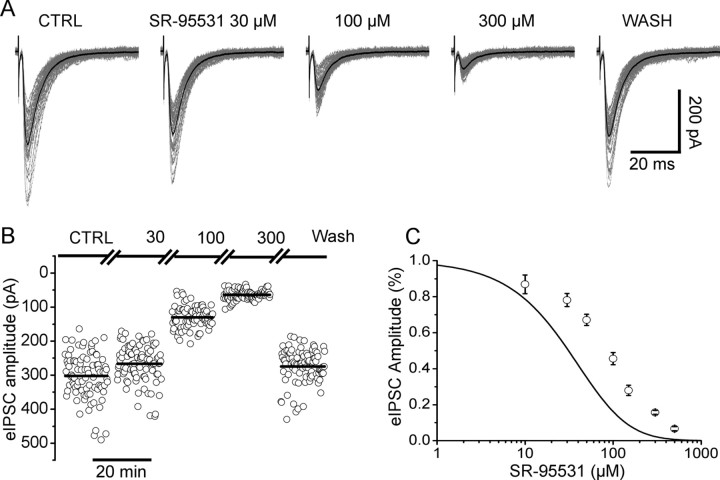
Figure 2.
The effect of SR-95531 on evoked glycinergic IPSCs. A shows the evoked responses in control (left) and in the presence of increasing concentrations of SR-95531. Individual sweeps (>50) are shown in gray, superimposed to the average IPSC (in black). The amplitude of individual responses is shown in B for the three concentrations of SR-95531 tested in this cell. Complete wash of the antagonist was achieved after 5 min. C shows the experimental dose–inhibition curve obtained pooling data from 45 cells. The continuous line is the dose inhibition calculated from the equilibrium constant (KB = 120 μm). The discrepancy between the equilibrium curve and the observed data indicates that significant unbinding of the antagonist occurs during the pulse of synaptically released glycine. Error bars indicate SDM.

