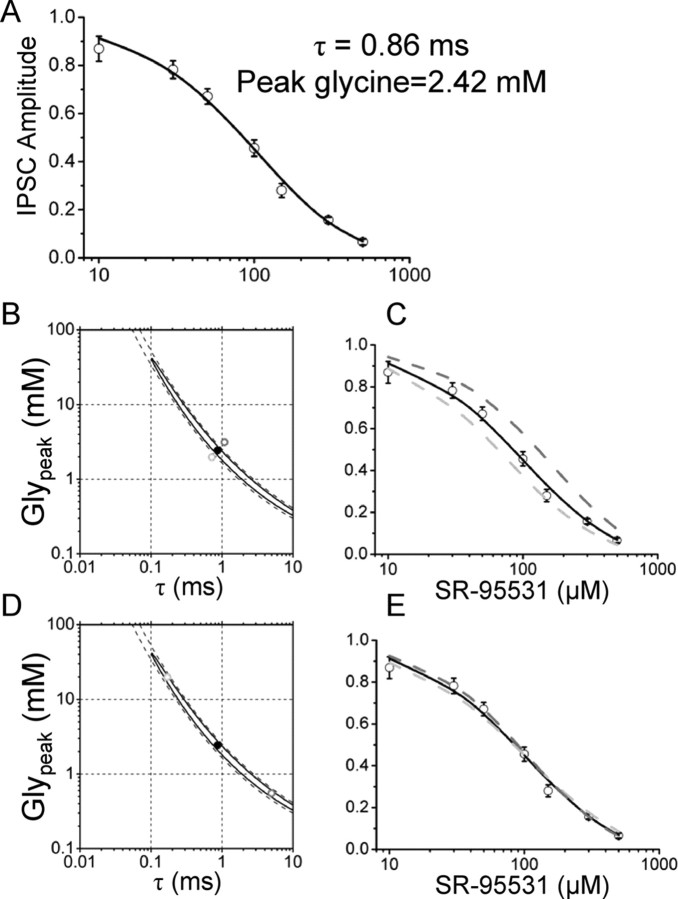
Figure 6.
Fitting the dose–inhibition curve of eIPSC does not determine the values of Glypeak and τ. The dose inhibition of Figure 2C was fitted by solving the equations for the scheme of activation of GlyRs using as free parameters the values of Glypeak and τ that determine the concentration and clearance time of glycine in the cleft. A, Values of Glypeak = 2.4 mm and τ = 0.86 ms provide a satisfactory fit of the data points. B shows the 95% (continuous line) and 99% (dashed line) confidence interval for the estimate of the two free parameters. The region of confidence extends over two orders of magnitude for both Glypeak and τ. The calculated dose–inhibition curve corresponding to the best fit is shown again in C as a black line, superimposed to the calculated curves for values of Glypeak and τ slightly above (B, dark gray dot; C, dark gray dashed line) or below (light gray dot and curve in B and C, respectively) the confidence region. As shown, even a small variation outside the confidence region produces a poor fit of the experimental data. However, when values of Glypeak and τ were chosen within the confidence region but very far from the estimated values (D, light and dark gray dots), the calculated dose–inhibition curves (E, in light and dark gray) were not significantly different from the one corresponding to the best estimate for Glypeak and τ. Error bars indicate SDM.

