Figure 9.
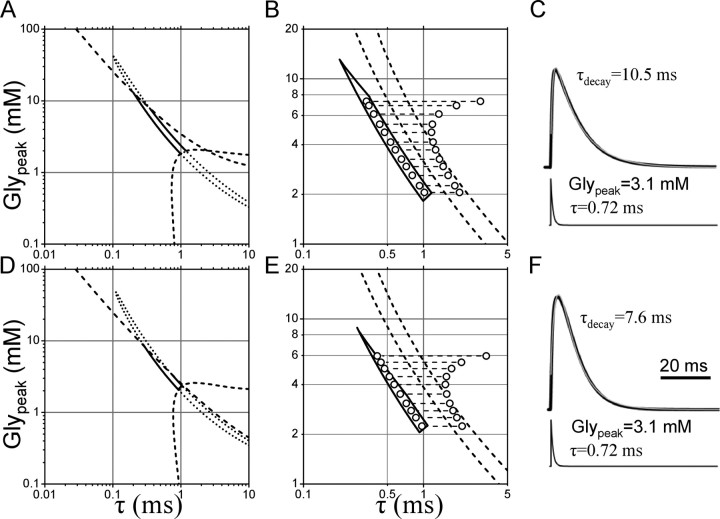
The values of Glypeak and τ can be determined by combining the experimental dose–inhibition curve with the observation of the increase in amplitude induced by block of the glial glycine transporter. The continuous line in A represents the 95% confidence limits in the estimate of Glypeak and τ. The dashed line in the bottom corner of the plot delimits the area below which the rise time of the calculated IPSC would be >1 ms, therefore limiting the acceptable values of Glypeak and τ to the region above the dashed line. The dashed line at the top of the plot indicates the region in which the amplitude of the calculated current is >80% of its maximum value. The intersection of this line with the 95% confidence region restricts the permitted value of Glypeak and τ to points below the dashed line to account for the observed >20% increase in amplitude of eIPSC induced by the block of the glycine transporter. B shows the resulting confidence region on an expanded scale. The increase in τ needed to increase the calculated peak current by 23% is shown by the length of the dashed lines joining the dots taken within the confidence region for Glypeak and τ. To account for the experimental results, the rightmost dots should give rise to calculated IPSCs that are 22 ± 5% inhibited by 50 μm SR-95531 (corresponding to the region delimited by the two dashed lines in B). C shows the time course of an IPSC calculated from the concentration profile of glycine shown at the bottom of the trace and the rates of the model in Figure 1H. The calculated IPSC is filtered at 500 Hz and fitted with a single exponential pulse function. The same analysis was performed using the model of Figure 1H without the extra desensitized states. The 95% confidence region comprises an area similar to the one shown above (compare D with A). Only the line delimiting the region corresponding to amplitude values <80% of the maximum is slightly shifted with respect to the one calculated in A. However, this does not affect the shape and boundaries of the remaining confidence region (shown on an expanded scale in E). Only values of Glypeak < 3.5 mm and τ > 0.6 ms can predict the 23% increase in amplitude observed with ORG-24598 together with the 22% inhibition observed with 50 μm SR-95531. F, Same as in C, but with desensitized states omitted.

