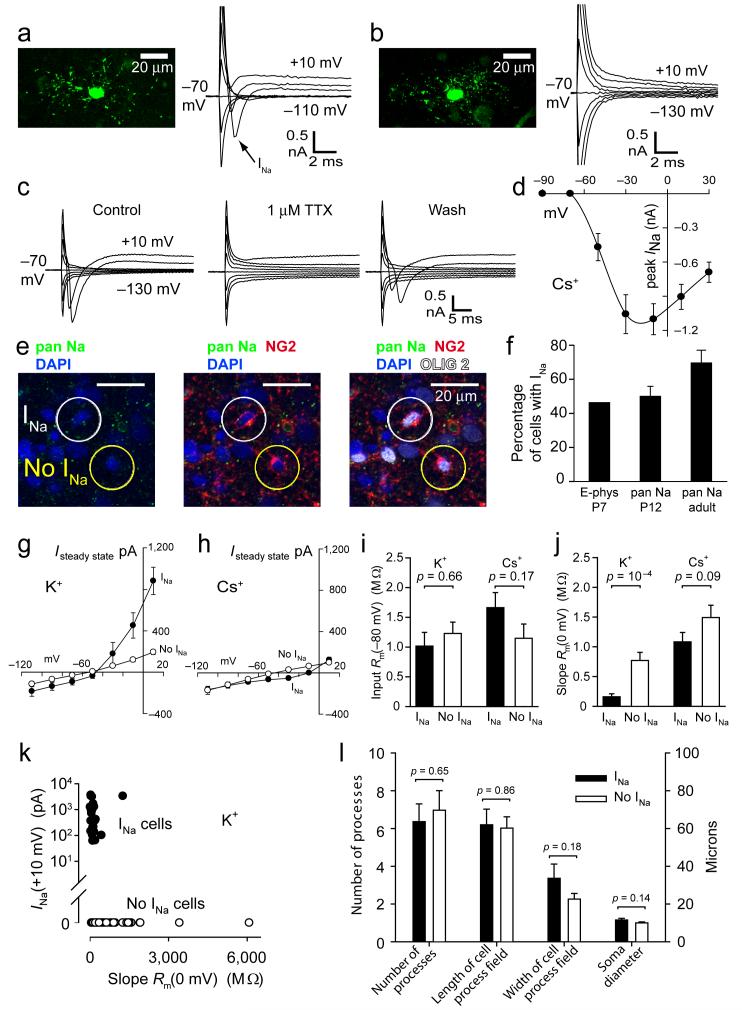
Figure 2. Two classes of oligodendrocyte precursor glia.
a P7 NG2 cell filled with Lucifer yellow, showing voltage-gated Na+ current (20 mV steps from -70 mV). b As a but cell lacking INa. c 1 μM TTX blocks INa. d Peak INa(V) (± s.e.m.) in 76 cells (Cs+ internal). e Fixed P12 cerebellar white matter labelled for voltage-gated Na+ channels (pan Na; non-NG2 cell labelling is presumably axonal), NG2 and Olig2. Circles show an INa and a no INa cell. f Percentage of white matter OPCs with INa by electrophysiology at P7, and by pan Na labelling at P12 (out of 101 NG2/Olig2 cells) and in adult (out of 28 NG2/Olig2 cells). g I-V relation at end of 0.2 sec voltage steps for 25 cells with and 51 cells without INa (K+ internal, at P7). h As g but Cs+ internal, 67 cells with and 55 without INa. i Input resistance at -80 mV. j Slope resistance at 0mV. k Peak INa on depolarizing from -70 mV to +10 mV, versus slope resistance at 0 mV (at P7). l Morphological parameters in 32 INa and 35 no INa cells at P7.

