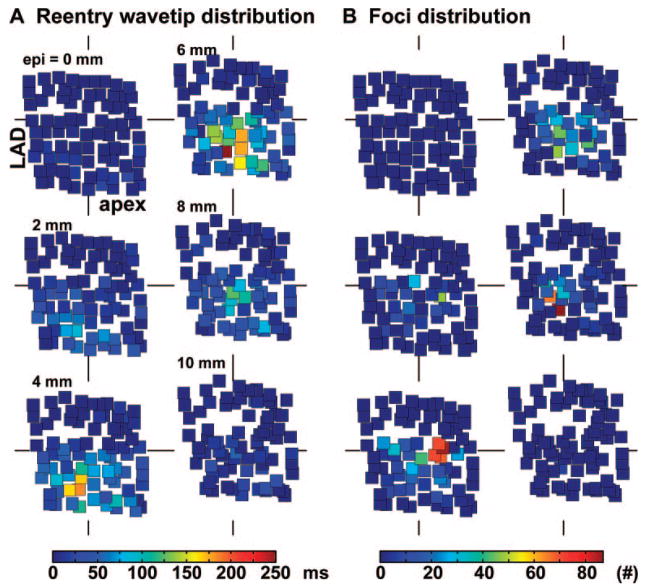
Figure 7.
Spatial distributions of reentry wavetips and sites of focal origins of wavefronts during 10 minutes of VF in 1 animal. The electrodes are divided into 6 planes as in Figure 5. Filled squares represent electrodes. In A, the color of the square indicates how long the electrode was on a reentry wavetip during the 10-minute period. In B, the color of the square represents the incidence of foci arising at that electrode. The corresponding color bars are shown at the bottom of A and B.

