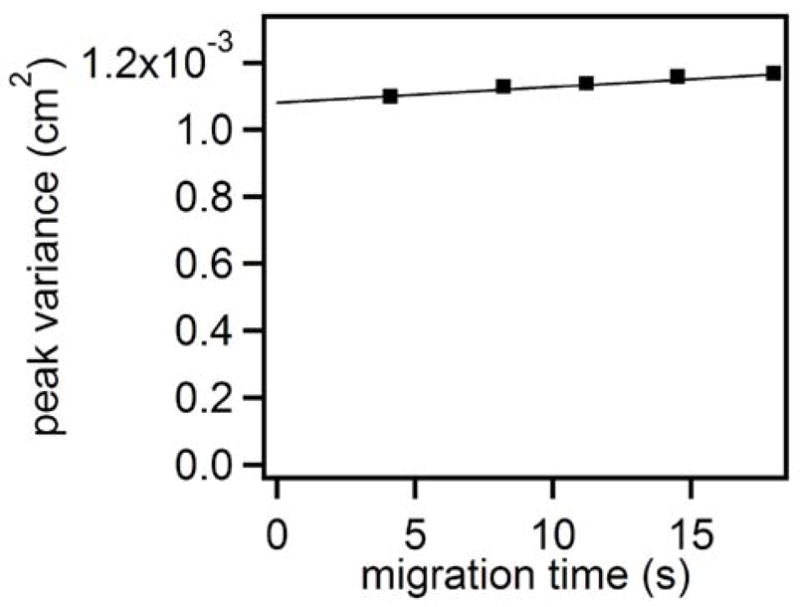
Figure 5.

Effect of migration through a 10 cm channel on peak variance. Measurements of peak variance were recorded at 0.2, 0.4, 0.6, 0.8 and 1 cm corresponding to the migration times shown. Field strength applied across the electrophoresis channel was 250 V/cm with a plug frequency of 1.5 Hz and a separation buffer of 10 mM sodium borate, 0.9 mM HP-βCD at a pH of 10.0. Sample plug volumes were approximately 15 nL.
