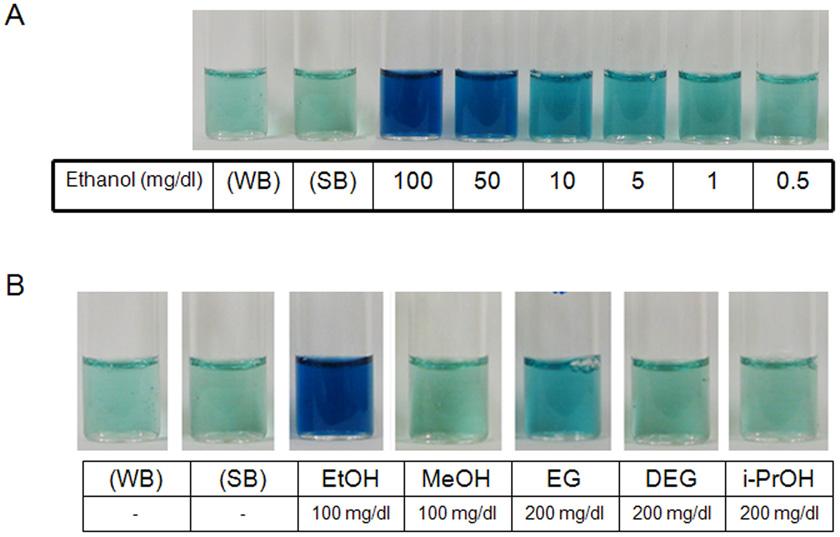
Figure 2. An example of typical experiments using the alcohol dehydrogenase method to detect the different alcohols in saliva.
Panel A) A light blue hue develops in the sample containing ethanol at a concentration of 1 mg/dl. The intensity of the color increases proportionately with the increase in ethanol concentration from 1 mg/dl to 100 mg/dl. WB, water negative control; SB, saliva negative control. Panel B) Comparison of the results with methanol (MeOH), ethanol (EtOH), isopropanol (i-PrOH), ethylene glycol (EG), and diethylene glycol (DEG) in saliva. The method was most sensitive for ethanol. Some slight increase in color intensity was detected with a ethylene glycol concentration of 200 mg/dl.

