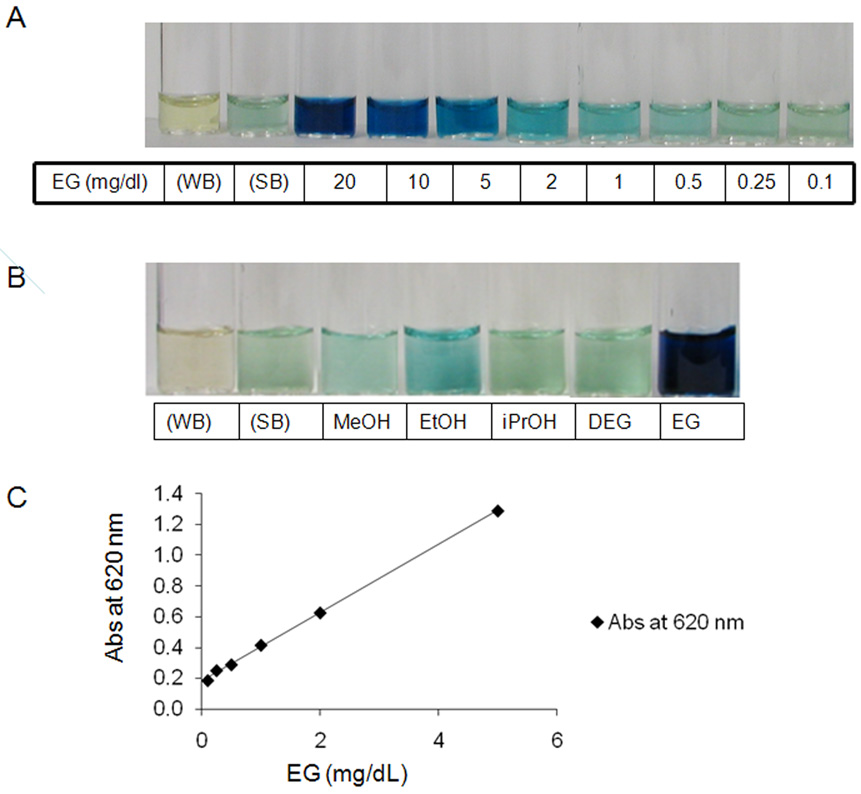
Figure 4. An example of typical experiments to detect the alcohols in saliva using the sodium periodate method.
Panel A) A light blue hue develops in the sample containing ethylene glycol at a concentration of 1 mg/dl. The intensity of the color increases proportionately with the increase in ethylene glycol concentration from 1 mg/dl to 100 mg/dl. WB, water negative control. SB, saliva negative control. Panel B) A light blue hue was noted with 50 mg/dl of ethanol, but methanol (MEOH), diethylene glycol (DEG), and isopropanol (iPrOH) at this same concentration were not different from the saliva control. Panel C) Relationship between ethylene glycol (EG) concentration and absorbance measured with a spectrophotometer. There is good linear relationship between absorbance and ethylene glycol concentration when it is < 10 mg/dl. Absorbance at 620 nm = 0.222 × EG (mg/dl) + 0.181 (R2 = 0.999)

