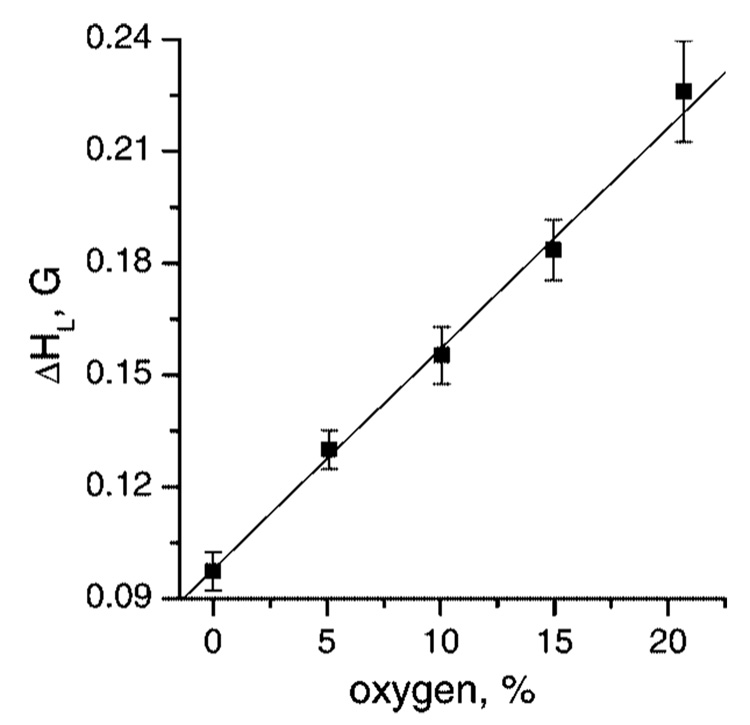
Figure 7.
The dependence of Lorentz peak-to peak line width, ΔHL, on oxygen concentration obtained by fitting the calculated spectra of aTAM4 to the experimental spectra measured at pH 9.9 and pH 5.8 as shown in Figure 6. Within the limits of experimental accuracy the values of ΔHL of individual lines of R (pH 9.9) and RH+ (pH 5.8) forms were not distinguished. Slope is (6.0 ± 0.5) mG per % oxygen.

