
Fig. 1.
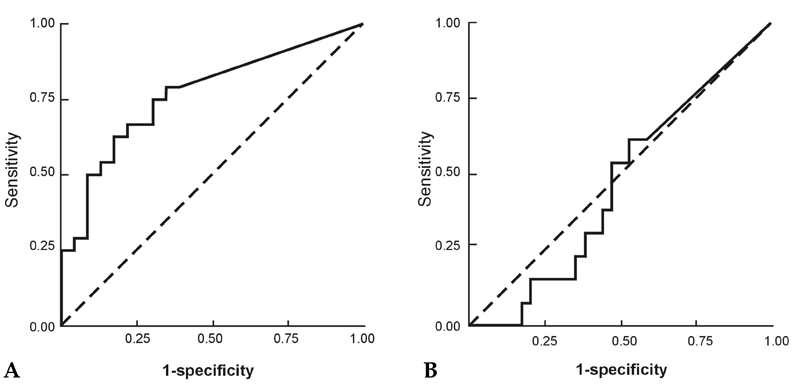
(A) Malignant ascites of chemonaive patients. The areas under the ROC curve were 0.766 (p = 0.002). (B) Malignant ascites of chemotreated patients. The areas under the ROC curve were 0.462 (p = 0.686). ROC, receiver operating characteristic.
Official websites use .gov
A
.gov website belongs to an official
government organization in the United States.
Secure .gov websites use HTTPS
A lock (
) or https:// means you've safely
connected to the .gov website. Share sensitive
information only on official, secure websites.
(A) Malignant ascites of chemonaive patients. The areas under the ROC curve were 0.766 (p = 0.002). (B) Malignant ascites of chemotreated patients. The areas under the ROC curve were 0.462 (p = 0.686). ROC, receiver operating characteristic.