
Fig. 4.
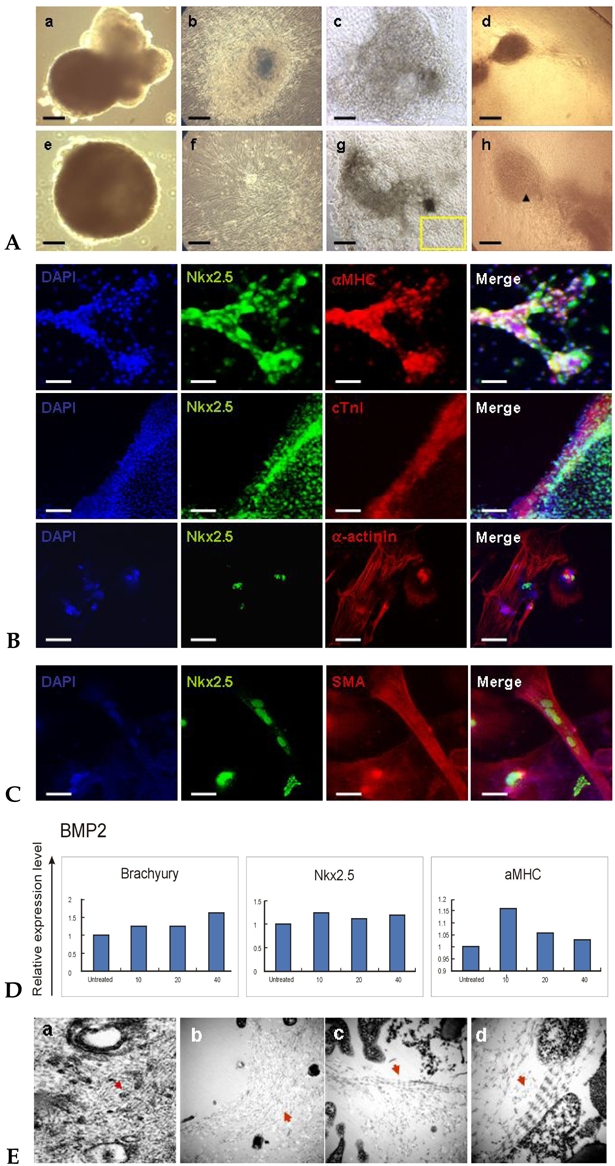
Evaluation of mesoderm- and cardiac specific markers in cardiomyocytes differentiated from BMP2-treated cells (SNUhES3). (A) Morphologies of long-term cultured embryoid bodies (EBs) and cardiomyocytes differentiated from BMP2-treated cells. Phase contrast microscopic appearance of 30-day EBs (a and e) in suspension and (b and f) after attachment, of hESC-derived cardiomyocytes 4 days (c) and 11 days after attachment (g), and contractile clusters derived from BMP2-treated differentiated cells (d and h) Bar: a-g, 500 µm; (h) 200 µm. (B) Expression of cardiac specific markers in differentiated cardiomyocytes. Differentiated cells were evaluated 20 days after plating and nuclei were stained with DAPI. Top panel, expression of transcription factor Nkx2.5 and protein αMHC; Middle panel, expression of Nkx2.5 and cTn I; Bottom panel, expression of Nkx2.5 and α-actinin (arrow of Fig 4A-h). Bars: 100 µm. (C) Expression of Nkx2.5 and smooth muscle actin (SMA), which is abundant in peripheral cells of cardiomyocyte cluster (yellow box of Fig. 4A-g). Bars: 100 µm. (D) Relative expression of cardiac lineage markers evaluated by Q-PCR. Differentiated cells showed significant expression of Brachyury, Nkx2.5 and αMHC. At 10 ng/mL of BMP2, αMHC expression was the highest, and beating cells were observed in this group (Suppl. Fig. 1). (E) Ultrastructures of differentiated cells observed by transmission electron microscopy (TEM). Red arrows, (a) Z bodies (dense spots), which are the precursors of Z bands. (b) unorganized Z bands. Many unorganized, unconnected bands were observed in many parts. (c and d) organized Z bands. Magnification, a, × 12K; b, × 30K; c, × 60K; d, × 100K.